1 Introduction
This guide is a translation of the Southern Africa Labour and Development Research Unit (SALDRU) course, The Analysis of South African Household Survey Data, from Stata to R statistical package. The original course provides an introduction to using Stata to investigate interesting policy issues in South Africa utilizing real household survey data. This guide therefore compliments the Stata course to help students and interested analysts on how to investigate policy issues using survey data with the help of the R statistical package. This document will be useful to:
Those who do not have access to one of the traditionally used statistical software such as Stata, SPSS or SAS (as R is free of charge).
Analysts who are already familiar with the aforementioned statistical software but who would like to use R for data alaysis.
Since this is a translation of Stata code to R code, this document is NOT a proper introduction to R. The structure of the original course makes it possible to introduce Stata while carrying out the analysis. The learning curve is however different for R and those new to R should use this document together with other comphrensive guides for the relevant topic or package functionality that are available online. Links to relevant guides about R resources are provided at the end of this document.
Since R is diverse in functions that can perform the same task, this document provides opinionated approaches to common operations followed when conducting data analysis: import datasets, do data exploration, do basic data manipulation operations where necessary, produce descriptive statistics and test hypotheses.
Examples provided in this guide, use the National Income Dynamics Study (NIDS) training dataset used in the Stata course. Note that this dataset is for training purposes only and if you want the proper NIDS dataset, you need to apply for the data on the DataFirst website
1.1 What is R?
R is described as a free software environment for statistical computing and graphics (R Core Team year). It is a dialect of the S programming language that was developed in the 1970s. R can be downloaded from the Comprehensive R Archive Network (CRAN) website free of charge. Installation instructions as well as guides, tutorials and FAQ are available on the same website.
R has become increasingly a popular tool for data analysis (see this article by Robert A. Muenchen) within the statistical community and the academic world for teaching. One of its strengths is that R is extensible to implement cutting-edge analyses that are not yet available in proprietary packages. Muenchen’s article and another article by Revolutions Analytics, for example, shows the exponential growth in user-written packages. The R packages are the equivalent of Stata’s ado files that one can install and use for their analysis.
In addition to performing most of the tasks available in common statistical packages such as Stata, SPSS and SAS, R can be used for GIS map building, building interactive web applications and many more. R has multiple packages and functions to do the same analysis each with its own advantages and disadvantages. Therefore, users need to be flexible and to be aware of R’s flexibility.
R, through various packages, interacts easily with data from several formats such as Stata, SPSS, SAS and many more. There are also R tools that supports several static and dynamic output formats that incudes HTML, PDF, MS Word, scientific articles, websites, and more.
A comprehensive introduction can be found on the R Foundation https://www.r-project.org/about.html.
Figure 1.1 shows a standard R interface that appears when the programme is launched.

Figure 1.1: R interface
1.2 Pros and cons of R
1.2.1 Pros
- R is free and open source software, allowing anyone to use and, importantly, to modify it.
- R can be run and used for any purpose, commercial or non-commercial, profit or not-for-profit.
- R’s source code is freely available so you can study how it works and adapt it to your needs.
- R is free to redistribute so you can share it with your friends.
- R is free to modify and those modifications are free to redistribute and may be adopted by the rest of the community!
- R is a common tool among data experts at major universities.
- Therefore, it reflects well on a very competent community of computational statisticians.
- R is cross-platform - runs on Linux, Mac, PC, server, desktop, etc.
- R connects easily with other languages - can import/export a variety of formats.
- R has active user groups to help with questions.
- R supports extensions - developers can easily write their own software and distribute it in the form of add-on packages.
- R is flexible
- can handle complex or standard statistical practices, bayesian modelling, GIS map building, building interactive web applications, and building interactive tests.
1.2.2 Cons
R is based on S, which is now an old technology.
- R only has features that the community contributes.
- If no one feels like implementing your favorite method, then it’s your job!
Not the ideal solution to all problems (drawback of all software packages).
R is a programming language and not a software package - steeper learning curve.
R can be much slower than compiled languages.
1.3 What is RStudio?
RStudio is an IDE (integrated Development Environment) which runs on top of R. R is installed as the underlying engine that powers RStudio’s computations, while RStudio will provide command autocompletion, help files and an effective interface for getting things done quickly. RStudio provides rich user interface when compared to R and as a result has made R more accessible and easy to use. RStudio can be downloaded from the RStudio website: https://www.rstudio.com/.
Figure 1.2 shows shows a standard RStudio interface that appears when the programme is launched.
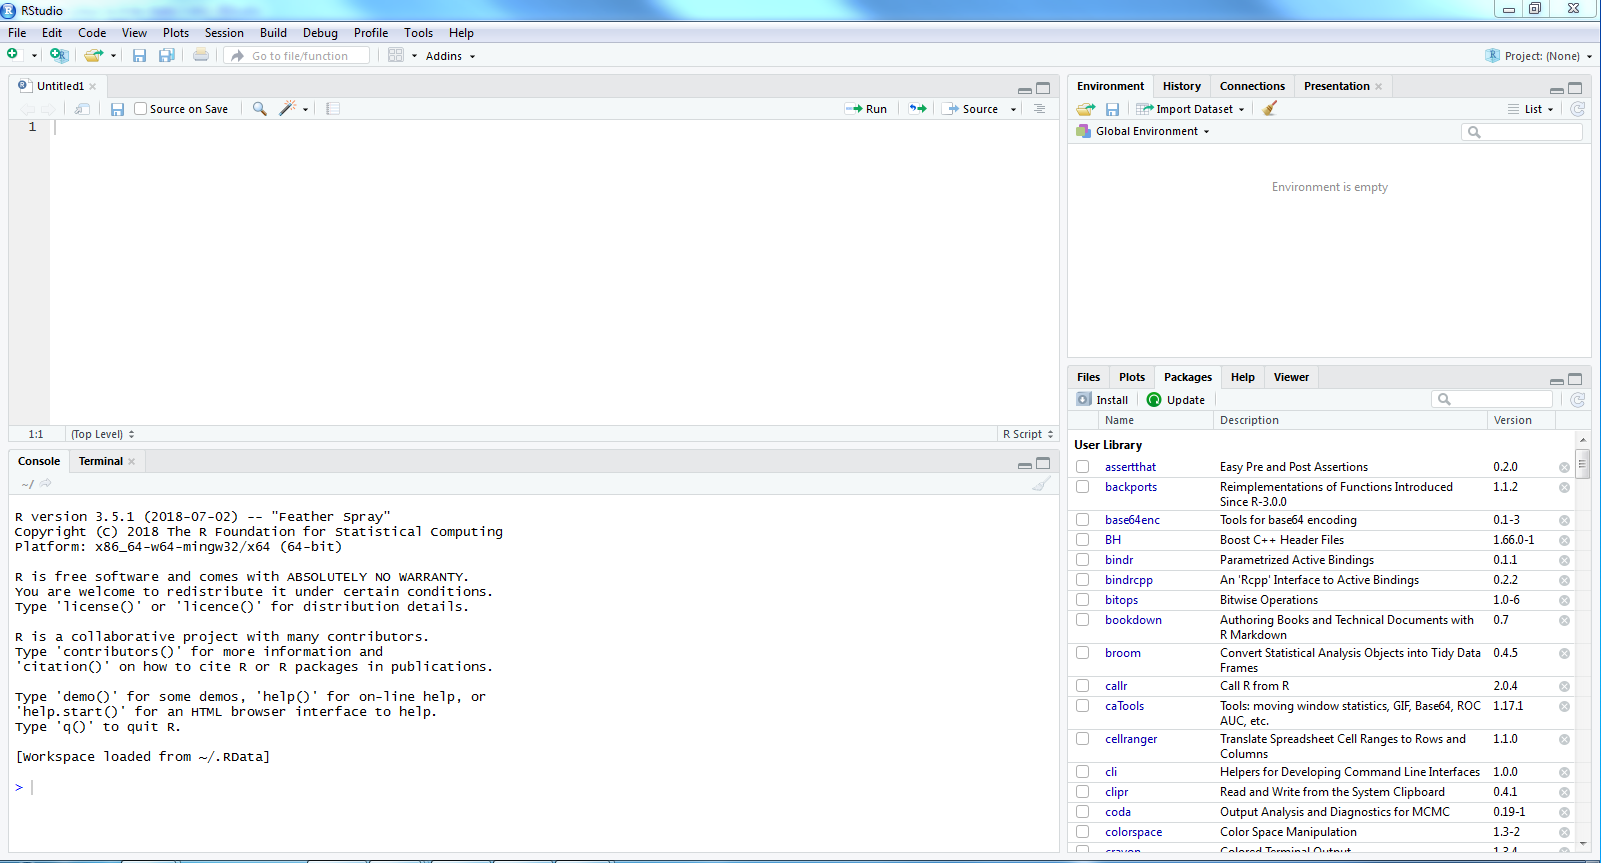
Figure 1.2: RStudio interface
RStudio has mainly four panels with various tabs:
Top-left - where you type source code, like the script editor in Stata.
Bottom -left - is the console, where you see what R is doing.
Upper- right - where you see your list of R objects and things in your workspace (explained in the sections to follow). This is also where you can find your history of commands.
Bottom right is where you can see your file structure, graphical output, available packages, and help documents.
1.4 The R system
The R system is divided into 2 conceptual parts:
The “base” R system that you download from CRAN.
User created packages that allows specialized statistical techniques
R functionality is divided into a number of packages.
The “base” R system contains, among other things, the base package which is required to run R and contains the most fundamental functions.
The other packages contained in the “base” system include utils, stats, datasets, graphics, grDevices, grid, methods, tools, parallel, compiler, splines, tcltk, stats4.
There are also “Recommend” packages: boot, class, cluster, codetools, foreign,KernSmooth, lattice, mgcv, nlme, rpart, survival, MASS, spatial, nnet, Matrix.
1.4.1 Base system
The list of packages considered as base can be retrieved with some basic info calling:
#installed.packages(priority = "base")[, c(2, 3, 6)]
installed.packages(priority = "base")[, c(3, 6)] #less info than above to fit into window
## Version Imports
## base "3.5.1" NA
## compiler "3.5.1" NA
## datasets "3.5.1" NA
## graphics "3.5.1" "grDevices"
## grDevices "3.5.1" NA
## grid "3.5.1" "grDevices, utils"
## methods "3.5.1" "utils, stats"
## parallel "3.5.1" "tools, compiler"
## splines "3.5.1" "graphics, stats"
## stats "3.5.1" "utils, grDevices, graphics"
## stats4 "3.5.1" "graphics, methods, stats"
## tcltk "3.5.1" "utils"
## tools "3.5.1" NA
## utils "3.5.1" NA